
Introduction
Fiddler is one the most popular tool to inspect your Http Traffic. This tool helps you to test REST API /SOAP Web requests very easily. Fiddler acts as Web Proxy and it sits between Client Application and Web Server. Fiddler only starts capturing traffic when you running it. By default, it runs on a local machine (127.0.0.1) Port 8888. You can change the default port from Tools > Fiddler Options.
How to capture HTTPS traffic in Fiddler
By default Fiddler doesn’t show the content of Web requests made to HTTPS Url (Secure site) because it's encrypted. Perform following steps if you want to see HTTPS Traffic.
- Launch Fiddler
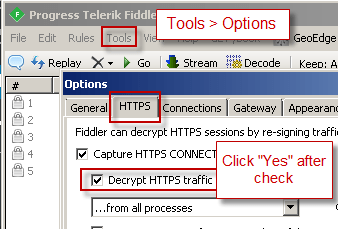
- Go to Tools > Fiddler Options > HTTPS > Check [Decrypt Https Traffic Option]

Fiddler Option – Decrypt HTTPS Traffic
- Once prompted Accept certificate generated by Fiddler
How to start/stop Fiddler Capture
Run fiddler to start capturing web requests/response made by various client applications on your system (e.g. Curl, Chrome, Internet Explorer). To start/stop capture go to File > Check/Uncheck [Capture Traffic] option.
By default when you run Fiddler it behaves as default proxy server on your system. However, not all web requests appear in fiddler unless client application using system Default Proxy.

Start / Stop Fiddler Capture
How to show SSIS PowerPack requests in Fiddler
In most cases, SSIS PowerPack requests will appear in Fiddler without any extra configurations. However, in some cases, applications like SSIS PowerPack cannot detect it as System Default Proxy automatically. In that case, try to enable Proxy settings in HTTP Connection or OAuth Connection. If you are not using connection manager then some Components like JSON Source offers its own Proxy tab so just check Enable Proxy.
By default Fiddler register itself as Default Web Proxy on port 8888 (i.e. http://127.0.0.1:8888 )

Using Proxy Settings in SSIS PowerPack
View HTTP Request in Fiddler
To inspect HTTP Web Request using Fiddler perform following steps.
- Click on the web request entry on the left pane
- Click on the Inspector Tab > Click Raw from the top panel
View HTTP Response in Fiddler
To inspect HTTP Web Response using Fiddler perform following steps.
- Click on the web request entry on the left pane
- Click on the Inspector Tab > Click Raw from the bottom panel
- You can also click on JSON or XML Tab if you want to see the response coming in the specific format
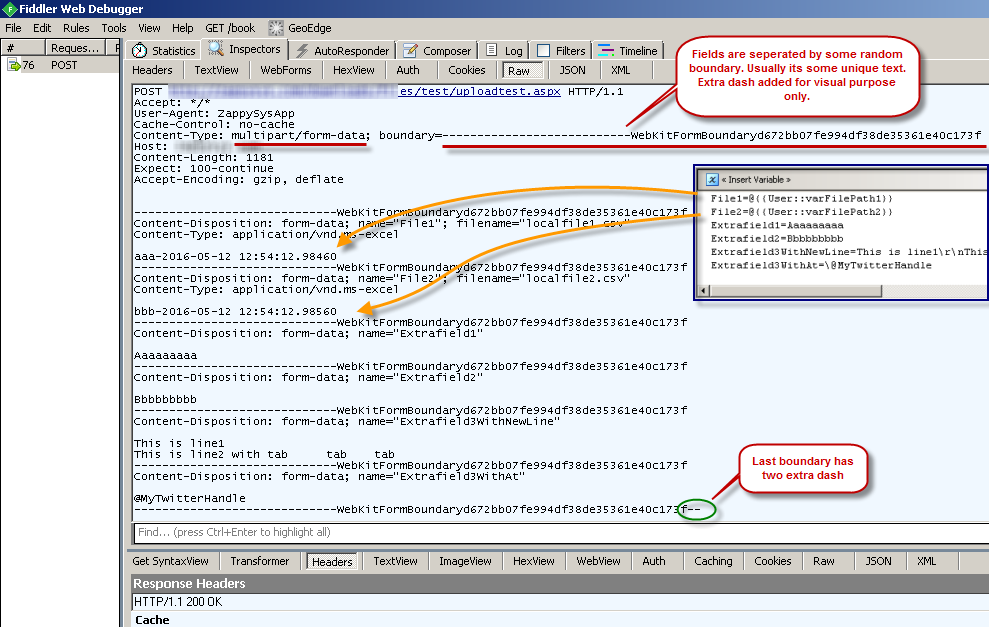
HTTP Multipart POST – File Upload Example – Check Fiddler Request
View compressed (i.e. gzip, deflate) Response in Fiddler raw view
When a response is compressed then by default you won't be able to see it in the Raw tab. When the response is compressed you may see a header like below in response headers. You can also click on
Content-Encoding: gzip
To view compressed response in fiddler perform following steps.
- Click on the web request entry on the left pane
- Click on the Inspector Tab > Click Transformer tab from the bottom panel
- Click on transformer tab and select No compression option and then click the Raw tab
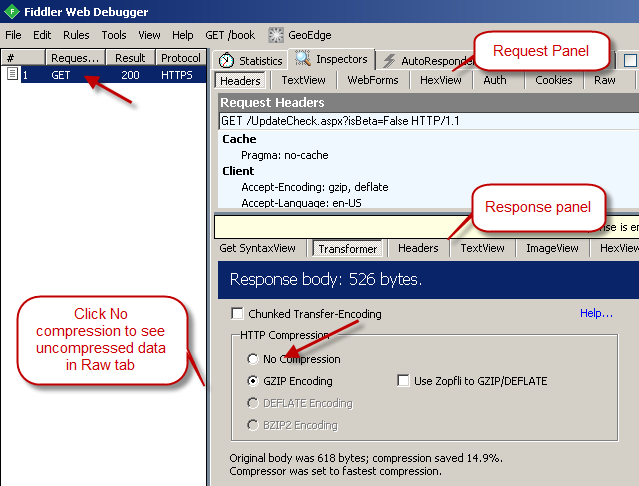
View uncompressed data in Fiddler (GZip, Deflate Encoding)
How to show web request of Curl in Fiddler
By default, some application such as Curl doesn’t use system default Proxy. That means if you running Fiddler and trying to analyze requests made from Curl command line then it won't show up. It's easy to tell curl that which proxy server to use. Just use -x command line option with proxy server IP and Port (e.g. Default Fiddler IP and port … 127.0.0.1:8888 )
curl.exe -v -x 127.0.0.1:8888 https://google.com
How to show SoapUI requests in Fiddler
If you are using an application like SoapUI then also it may not use Fiddler as a default web proxy. to show your SoapUI web requests in Fiddler try following options

Configure Proxy Settings in SoapUI
How to show AWS command line requests in Fiddler
If you are using AWS command line application and want to show requests in Fiddler then add –no-verify-ssl like below. This way you can capture RAW API requests and use it like this in SSIS.
aws lambda invoke --function-name HelloWorld c:\temp\outputfile.txt --no-verify-ssl --payload file://c://test/customer.json
Contact Us
If you have more question(s) feel free to contact us via Live chat or email to support@zappysys.com
Comments
0 comments
Please sign in to leave a comment.